Public court data · Arizona
Arizona bankruptcy filings
A source-linked tracker of filings, chapter filters, pro se counts, and court-division totals.
Latest complete comparison
7,842
filings, Jan–Jul 2026 · 7.8% higher than Jan–Jul 2025
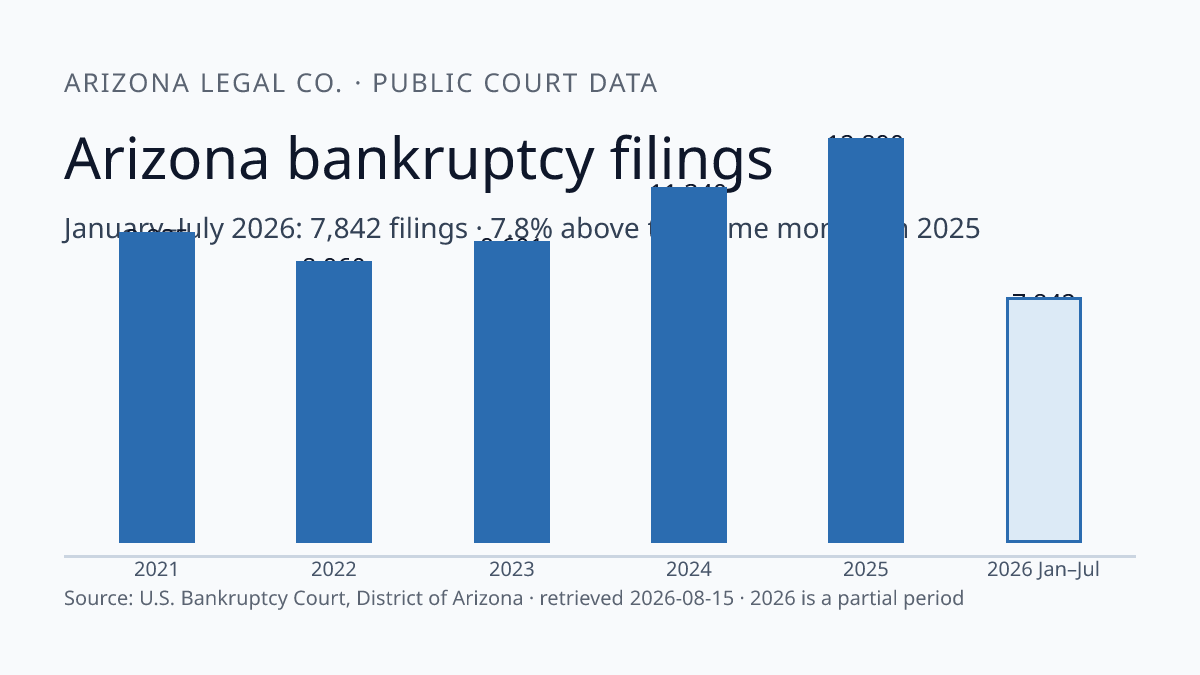
Filings by year
Arizona recorded 7,842 filings from January through July 2026, compared with 7,274 in the same months of 2025. The final bar is a comparable partial period, not a forecast or full-year estimate.
Source: U.S. Bankruptcy Court, District of Arizona · retrieved 2026-08-15 · updated 2026-08-15.
| Period | Filings | Status |
|---|---|---|
| 2021 | 9,885 | Full calendar year |
| 2022 | 8,960 | Full calendar year |
| 2023 | 9,601 | Full calendar year |
| 2024 | 11,340 | Full calendar year |
| 2025 | 12,890 | Full calendar year |
| 2026 Jan–Jul | 7,842 | Comparable Jan–Jul period |
Chapter mix
The Chapter 7, 11, and 13 filters show the mix among filings from January through July 2026. Their total is 2 below the all-chapters total; the court dashboard does not expose a fourth chapter filter here, so it is left unclassified rather than named.
Source: U.S. Bankruptcy Court, District of Arizona · retrieved 2026-08-15 · updated 2026-08-15.
| Filter | Filings | Share of all filings |
|---|---|---|
| Chapter 7 | 6,375 | 81.3% |
| Chapter 11 | 89 | 1.1% |
| Chapter 13 | 1,376 | 17.5% |
Pro se share
The dashboard shows 1,379 pro se filings out of 8,337 total filings through August 15, 2026: 16.5%. The last point is a partial-year share and is not a full-year result.
Source: U.S. Bankruptcy Court, District of Arizona · retrieved 2026-08-15 · updated 2026-08-15.
| Period | Pro se | All filings | Share |
|---|---|---|---|
| 2021 | 1,323 | 9,885 | 13.4% |
| 2022 | 1,290 | 8,960 | 14.4% |
| 2023 | 1,432 | 9,601 | 14.9% |
| 2024 | 1,675 | 11,340 | 14.8% |
| 2025 | 1,864 | 12,890 | 14.5% |
| 2026 through Aug. 15 | 1,379 | 8,337 | 16.5% |
Phoenix and Tucson division filings
The source supports court-division filters for Phoenix and Tucson. They are reported as divisions, not counties; the two series do not represent the statewide total and should not be used as a population comparison.
Source: U.S. Bankruptcy Court, District of Arizona · retrieved 2026-08-15 · updated 2026-08-15.
| Period | Phoenix | Tucson |
|---|---|---|
| 2021 | 6,714 | 2,342 |
| 2022 | 6,090 | 2,216 |
| 2023 | 6,440 | 2,419 |
| 2024 | 7,509 | 2,904 |
| 2025 | 8,579 | 3,249 |
| 2026 through Aug. 15 | 5,590 | 2,062 |
Methodology and limits
How to check this tracker
Source and refresh
U.S. Bankruptcy Court, District of Arizona — Interactive Case Filing Statistics Dashboard. Pulled 2026-08-15; refresh monthly.
Reproduce
Downloaded the court dashboard feed on 2026-08-15 and retained the full aggregate snapshot. The published CSV is a compact, reader-ready extract of the rows used on this page.
The reproducible scraper and aggregate snapshot are maintained with the site source. The downloadable CSV is the compact extract used above.
- These are filing counts, not the number of unique people or households. The court includes case re-openings.
- The court updates the dashboard throughout the day and says historical totals may change as filing records settle.
- 2026 is incomplete. This page uses January–July for the year-over-year filing comparison and labels every other partial-period figure.
- Phoenix and Tucson are court-division filters in the source dashboard. They are not a county map, and they do not add up to the statewide total because the court also reports other offices.
- This compilation uses aggregate public counts only. It does not include case numbers, party names, addresses, or any other personal case data.
Related information
Keep the data in context
Filing counts show court activity, not what any one person should do. Arizona Legal Co. publishes general legal information and court-data context; it is not a law firm and does not provide legal advice.